Breaking Down the Numbers: What Different Training Metrics Mean

If you’re new to triathlon (or even if you’ve been in the sport for a while), you might not know about all of the different training metrics. TrainingPeaks, the most popular platform used to monitor workouts, tracks a lot of data from your workouts, but if you’re not familiar with the different metrics and what they mean, the numbers aren’t going to be of much use to you. We are going to take a look at the many metrics of swimming, biking and running (all of which can be found on TrainingPeaks), breaking down how you can use each one to produce your best results.
Heart Rate
You may have heard athletes discussing different zones for workouts. Different coaches will define different zones (sometimes as many as seven), but most will break different training levels into five zones, with Zone 1 being the easiest and Zone 5 being the hardest – basically working at your maximum heart rate. The different zones are based on a percentage of your maximum heart rate, but how are you supposed to figure out what your max really is?
There is a simple formula often used to determine your max heart rate, but it may not be the most accurate. That said, it’s better than nothing. The most common formula used to determine max heart rate is 220 minus your age. From there, you can figure out your different zones.
Zone 1 is very light at 50 to 60 percent of your max heart rate (the BPM you should see during warmups). Zone 2 is 60 to 70 percent of max, which is what you’re aiming for on easy runs. Zone 3 is 70 to 80% (what some coaches may call “comfortably uncomfortable”), followed by the Zone 4 threshold pace, which is 80 to 90 percent of your max, and finally from 90 to 100 percent in Zone 5, which is reserved for short bursts and sprints.
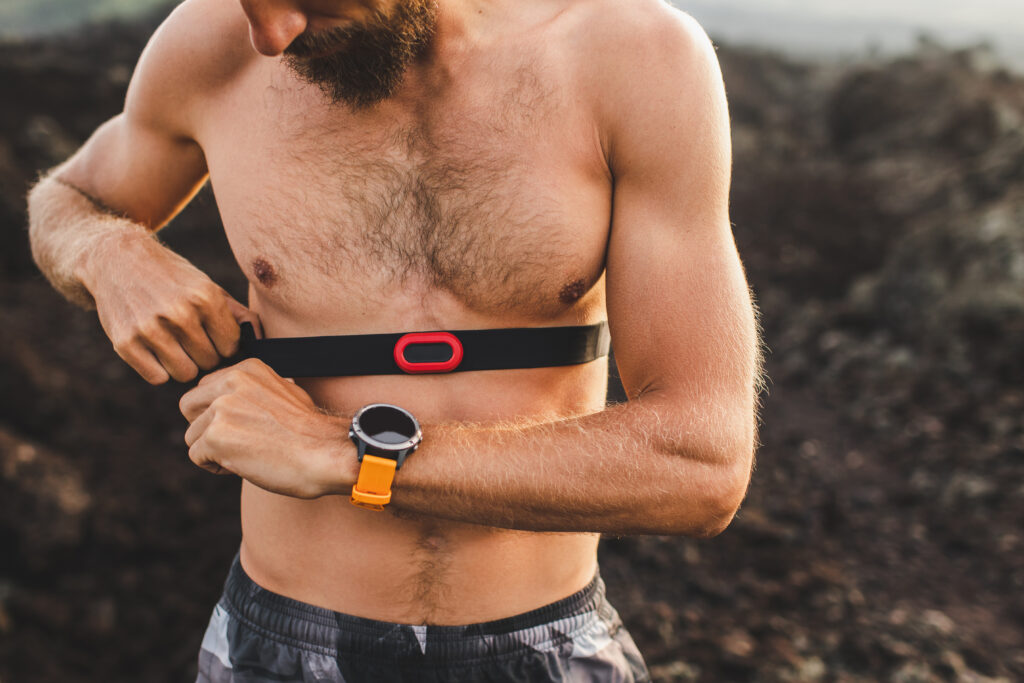
If you want a more precise result, consider running a test to determine your lactate threshold heart rate (LTHR). This is a relatively simple test that you can do on your own with just a heart rate monitor and timer. It’s a 30-minute time trial (conducted at race pace), but you’re only going to record your heart rate for the final 20 minutes.
That 20-minute average will give you your LTHR. From there, you can input your LTHR into TrainingPeaks, which will then generate appropriate heart rate ranges for each zone.
Although this test is more precise than the 220 minus your age formula, it is still not perfect. If you don’t pace the 30-minute time trial well, it could skew your final results. To combat this, you can perform the test multiple times, dialling in the pacing and therefore getting a more accurate result.
Power for Cycling
Perhaps the most popular metric to track in cycling is power. It’s such a favourite of cyclists because it’s an objective metric that is not impacted by outside forces like wind or terrain. Simply put, it’s how hard you’re pushing your pedals. Your weight is also factored into the equation, making power a measure of watts per kilogram (w/kg).
As with heart rate, there is a test you can perform on your own to determine your power levels. It’s called a Functional Threshold Power (FTP) test, and it only takes 20 minutes. You can do this test outside, but best results will come inside on your trainer. If you want to take it on the road, you’ll need to find a very long stretch with no stops (no lights, no stop signs, nothing) and no descents. Even a quick stop or the slightest decline grade will mess with your results, which is why the indoor trainer is best for FTP tests.
Using a power meter or smart trainer to record your data, you’ll ride 20 minutes as hard as you can, trying to keep the power consistent from start to finish. Just like with the LTHR test, this might take a few tries to get right, as many people start too hard and fade toward the end of the 20 minutes (or vice versa, starting too slow and reaching the finish with more in the tank).
After this 20-minute ride, you’ll have your FTP. From there, you can calculate your w/kg by, you guessed it, dividing your FTP by your weight in kilograms. Generally, this number will be what you can hold for an hour on the bike, giving you a great gauge on what you’ll be capable of at different races.

Power for Running
Similar to cycling, power is a useful tool in running since it is independent of your training environment and is, instead, all about effort. Your pace can slow when you hit a hill or run into a headwind and your heart rate can spike in hotter conditions or at higher altitudes, but your power will remain consistent in all settings.
Some running watches can calculate power. There are also pod devices that strap to your shoe and can connect to your watch, or phone, to show you your power data. Unlike in cycling, a bit more info goes into determining running power. Whatever device you choose to track it will look at your weight, pace, cadence, stride rate and more to come up with your power reading.
Once you have a way to measure your power, how do you figure out your zones? Continuing the trend set above, there is a test you can run. Once again, it is an FTP test, and all you need to do is run a hard 5K time trial. As with the other tests, treat this like a race and try to run at a pace you think you can hold for the full 5K. After the run, your average power for the effort will be your FTP, which you will then divide by your weight in kilograms.
Training Stress Score
Training stress score (TSS) is something you might have seen on TrainingPeaks, too. It is rated on a scale up to 100 per hour of training. A score of 100 means you spent a full hour at your maximum, whether that is based on power, heart rate, pace, or perceived effort. A one-hour workout at 50 percent exertion will earn you 50 TSS.
This score is completely subjective, meaning that if a rookie triathlete did a workout with a pro and they both rode at their limit for an hour, they would both record 100 TSS for the day. If you have a multiple-hour session, the TSS will be broken down by the hour. That means that if you worked out at 50 TSS for three hours, you’ll hit 150 TSS on the day. You can assign a TSS to each workout on TrainingPeaks, creating a graph for the year to show your training efforts day in and day out.

Acute Training Load
The acute training load (ATL) represents your fatigue (or projected fatigue). TrainingPeaks will look at your training from the past seven days and calculate on estimate of your fatigue. This can help you and your coach determine whether you need to take your foot off the gas a bit (if you’ve been doing too many days and workouts at high TSS), if you can afford to push a bit more (if your TSS has been middling or lower in the past week) or if you’ve got your schedule set up just right.
Further, you can use past ATL stats to shape your current and upcoming training schedules. If you have a race coming up in a month and you want to nail your build, you can look back at the weeks leading up to similar race from a past season to see what sort of training load you were dealing with then. If you nailed that past build and race, you can copy it (or keep it relatively similar) this time around.
Chronic Training Load
TrainingPeaks will use your TSS to determine your chronic training load (CTL), which pertains to your fitness. The CTL takes your training from the past 42 days and figures out your current fitness rating based on those workouts. This stat is ever-changing, with each new day of training impacting it more than the last (meaning if you have a few days of low TSS, your fitness rating will dip, while high TSS brings it up).
Training Stress Balance
As you might have noticed, CTL and ATL are directly linked, as a higher TSS will bump the numbers up in both categories. The key is to balance it out well enough to keep your fitness rating high without putting too much strain on your body with a too-high ATL. How can you figure out the right balance? With TrainingPeaks’ training stress balance (TSB) score.
The TSB subtracts your ATL from your CTL every day to produce what TrainingPeaks calls the Form. The Form shows a graph with a constantly changing line, sometimes driving high, sometimes dipping low. This will show you if you’re fit and ready to race (or ready to keep pushing hard in training) or if you’re fit, but too fatigued and need a bit of a break.

The TSB is perhaps the most important stat to keep an eye on if you use TrainingPeaks, as it will keep you informed on a daily basis and allow you to perfect your training schedule, promoting growth and development as an athlete and preventing sickness and injuries.
Normalized Power
While the power metrics listed above are all about averages, normalized power (NP) looks at the physiological cost of different power levels. The NP algorithm on TrainingPeaks puts more weight on high-intensity efforts, giving you a more accurate reading and a better estimate on your TSS, CTL, ATL and more.
Normalized Graded Pace
We have already noted how different terrains and running routes can impact numbers outside of power (especially your pace). That is where normalized graded pace (NGP) can come in handy. The NGP will look at GPS files from your runs, taking in the changes in grade and intensity of the workout on different terrains. It will then give you a new score with your original pace in mind. This way, you can compare a flat and fast 5K time trial to a hilly run or a tough outing on the trails and get an accurate read on how much better one is than the other.
Distance Per Stroke
Have you ever been swimming next to someone and noticed that your stroke rate is one and a half or even double theirs? You may be going the same speed as them, but who do you think will be able to go faster or farther — the swimmer taking more strokes or the one doing half as many?

That’s right, the swimmers with the most efficient strokes will fare better than those who are muscling their way through the water. A stat you might have noticed on your watch is distance per stroke, or DPS. DPS is just as it sounds: how far can you go with each stroke? The farther you go, the fewer strokes you’ll need to take over the course of a full swim. This will save your energy, helping you not only go faster in the swim overall, but also on the bike and run on race day.
Cadence
While in the pool you’re looking to take as few strokes as possible, it’s a bit different in running and cycling. When it comes to cadence on the run and on the bike, a higher number is actually better. For cycling, if you have a higher cadence (the number of pedal rotations per minute), it means you’re able to push farther and go faster. Likewise in running, a higher cadence means you’re taking shorter strides, reducing your impacts on joints and running more efficiently.
Rate of Perceived Exertion
What is rate of perceived exertion (RPE)? It’s simply a scale from one to 10 that you use to rate how hard you think a workout is or was. You can use the above metrics like power and heart rate to help you determine the RPE of a workout, but really it’s all about what you felt in the moment.
Was it hard, but manageable? It might be around a seven. Were you going at a pace you could only hold for a short sprint? Probably a nine or 10. Was the swim, bike or run light and easy? Likely a five or below.
It may seem like RPE is a useless stat since you have so many other objective numbers available to you, but it’s actually quite necessary to get in tune with your body and abilities. If your watch or power meter die on race day, you need to have a general idea of what you’re capable of doing for the length of the race. If you have no clue how hard to push without the numbers telling you what pace you’re currently going, then you risk either blowing up after pushing too hard or reaching the finish with way too much energy left.


I’m sorry, but as with any thread about tracking data, or metrics, or any such thing, I feel that I’m required to post this
Carry on
Bingo! If it’s NOT fun - whatever that means to someone, then they will not be consistent, they will not be invested in the long term - THE MOST important things in training - consistency and looking/planning long term!
* When you multiply your avg watts for the 20 min watts by .95