
Insights and Trends From the 2026 Kona Bike Count
The 2026 IRONMAN World Championship is now behind us, and now we’ve been able to take a little time and process some of the data we captured during the course of bike check-in. We’ve been spearheading the full distance bike count for a few years now, and it is a a full gas effort for our faithful group of media, brand representatives, and volunteers who help make this happen during bike check-in on Friday.
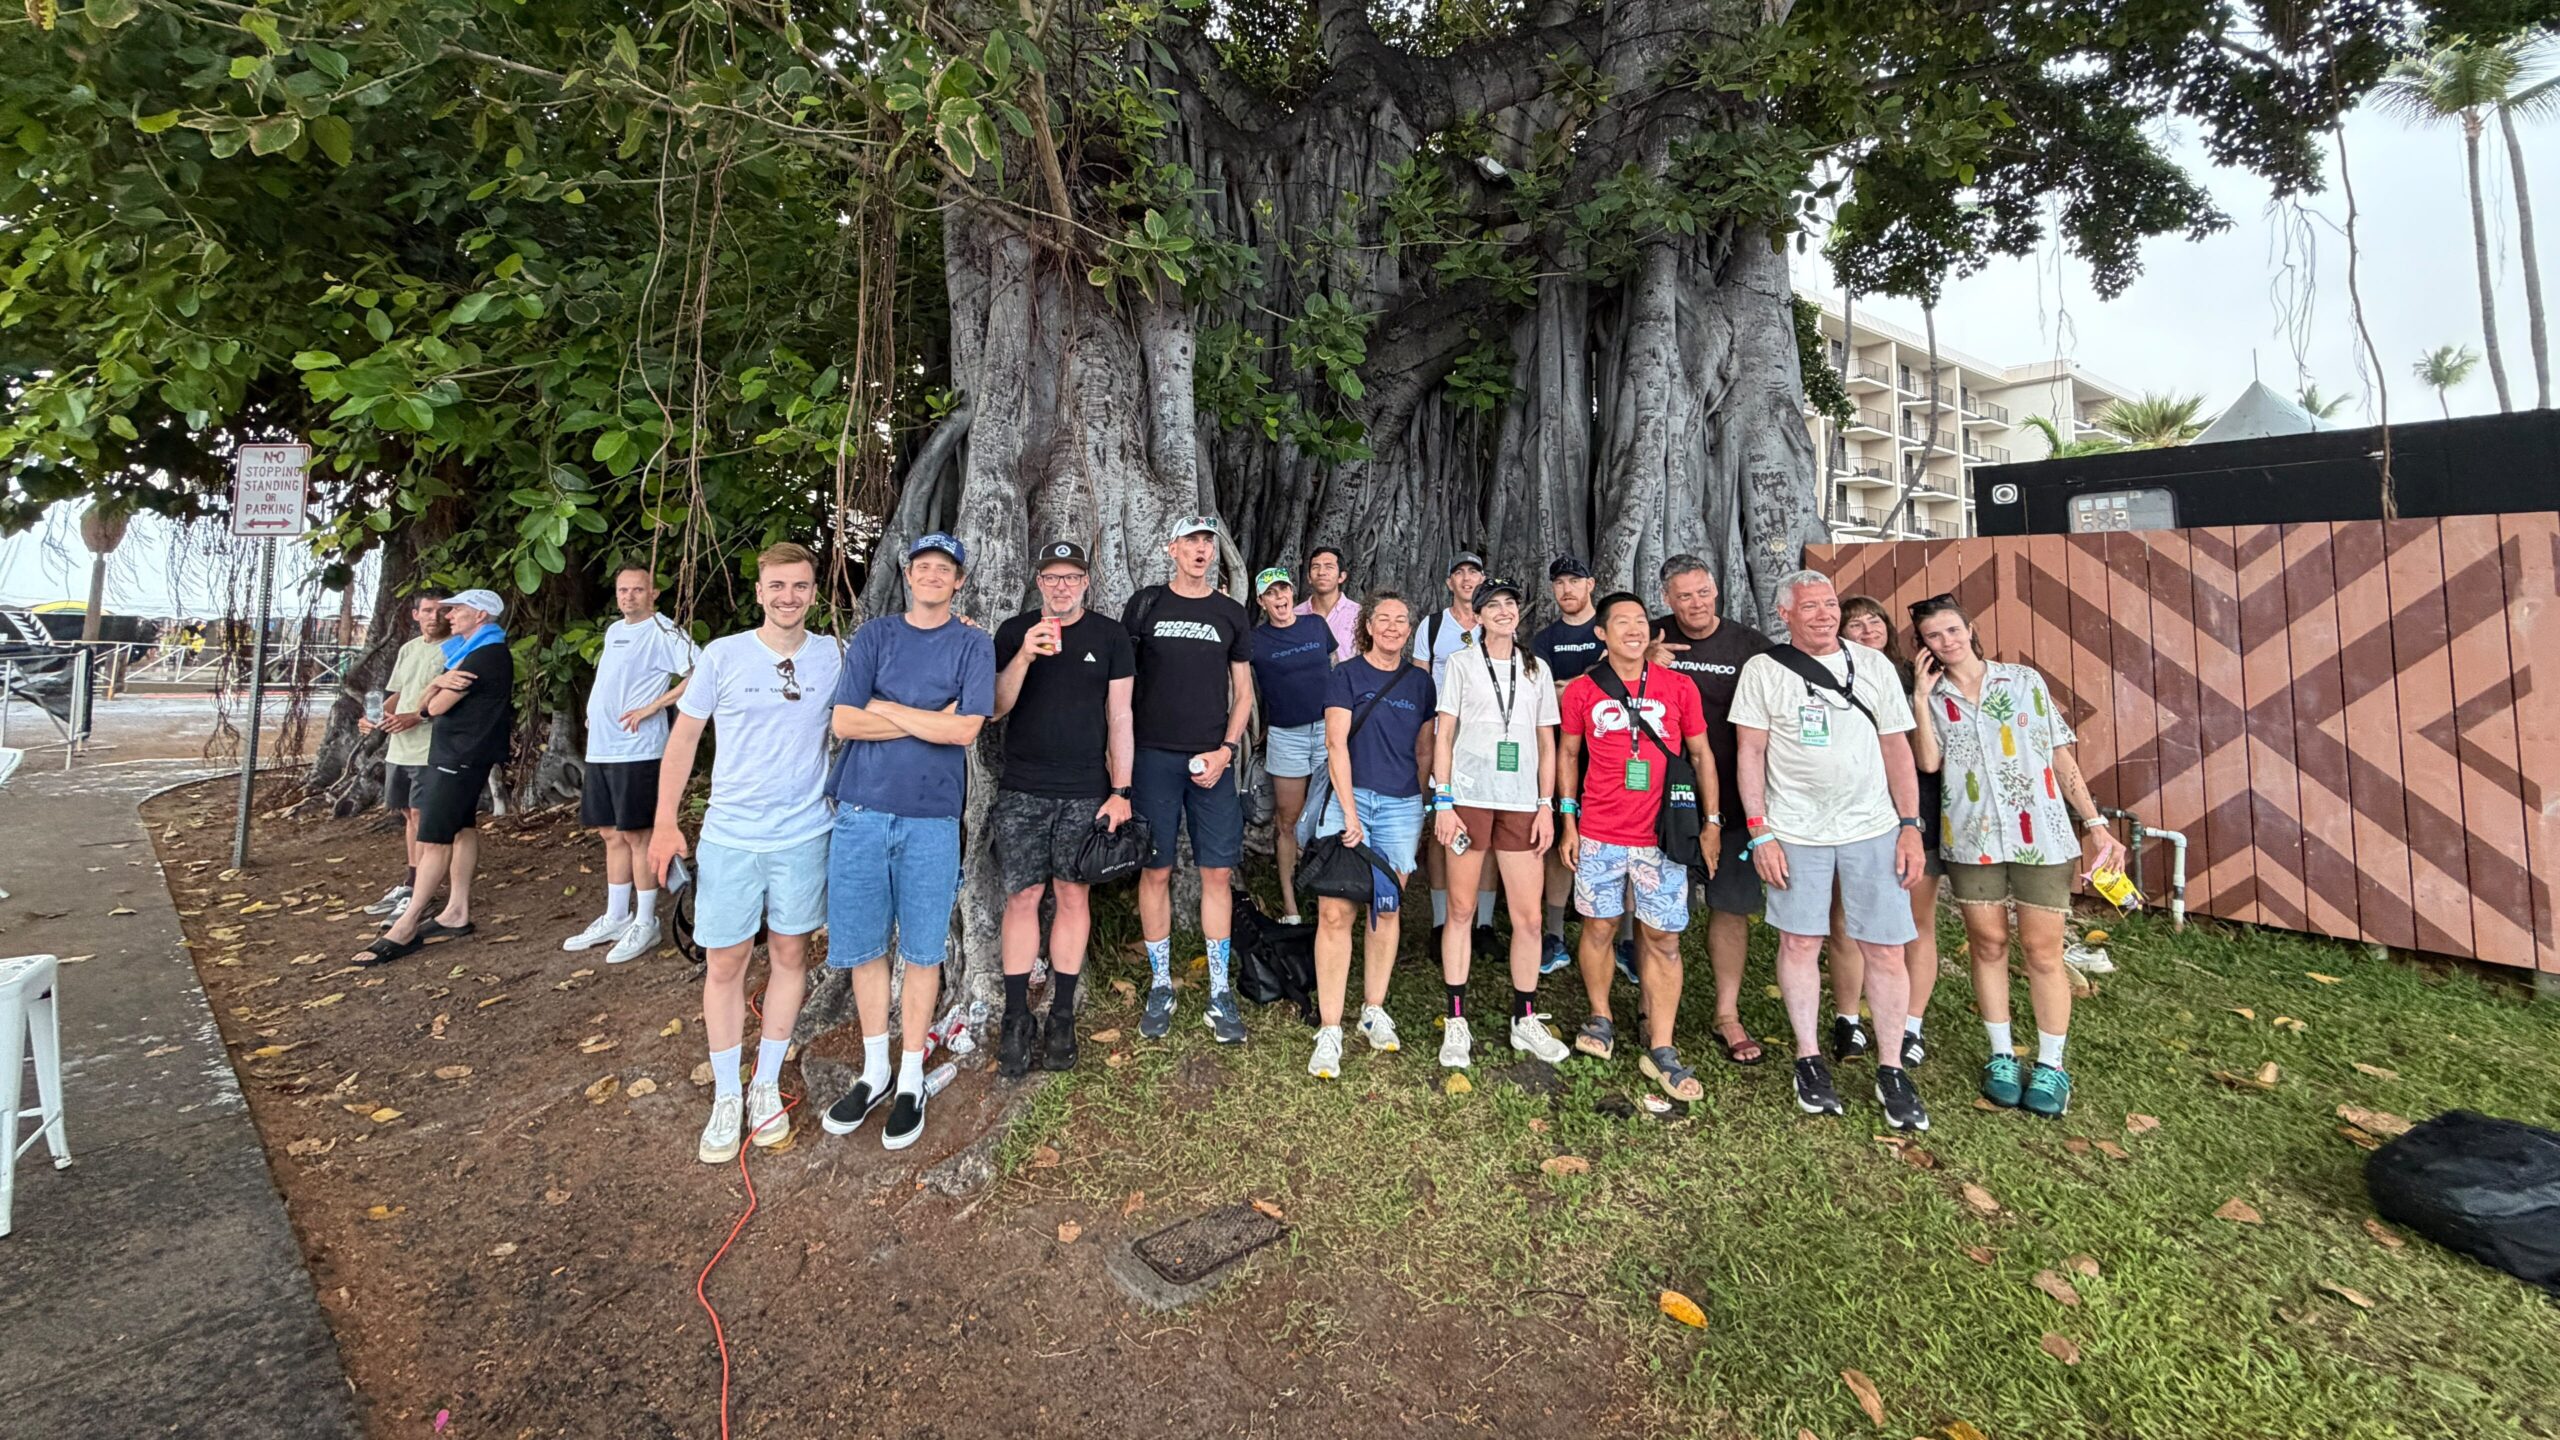
Before we dive into the trend numbers, let’s first peel back the curtain a little bit on how the raw data itself is captured. Counters are given specific space on one side of the pier as athletes walk their bikes through check-in. Athletes are released in a semi steady stream to rack their bikes. It is while on this walk that our team of volunteers enter in what they’re seeing. Each team member is given a specific component to look at; e.g., one person for bikes, one person for wheels, and so on. Counters are not allowed to stop or ask athletes questions; the flow of athletes through check-in is something that cannot be interrupted. Lather, rinse, repeat for roughly 2600 athletes over the course of the day.
Once upon a time, this was a pen, paper, and clipboard operation. Thankfully, we moved into the electronic age a few years ago. It’s improved both our ability to capture data and to be able to turn that data around into stories we and others, like our friends at Triathlete who help capture counts, report. There are a couple of drawbacks; namely, if we don’t put a brand as a submission option before the count begins, we’re not able to capture it. So, for instance, a couple of brands who are active participants in our forum — Culprit and Vanquish — are lumped into the “other” category for aerobars and bike categories, respectively.
It’s never perfect. We know we will undercount, just because sometimes you get a pack of 20 athletes at once who feel like the race started without them and they need to rack their bike right now. But what tends to be more important is how data trends develop over time. Which brands are gaining market share? Which ones are losing it? And are there other signals for us to keep an eye on?
Here’s what we found after combing through the data.
Canyon Keeps Capturing Market Share
One of the things that makes the 2026 bike count analysis slightly more difficult is that we can’t compare raw data counts year over year as, well, we’ve reduced the total number of bikes counted with the move back to a single day in Kona. Instead, we’re having to compare share of the count year over year to see directionally where brands are headed.
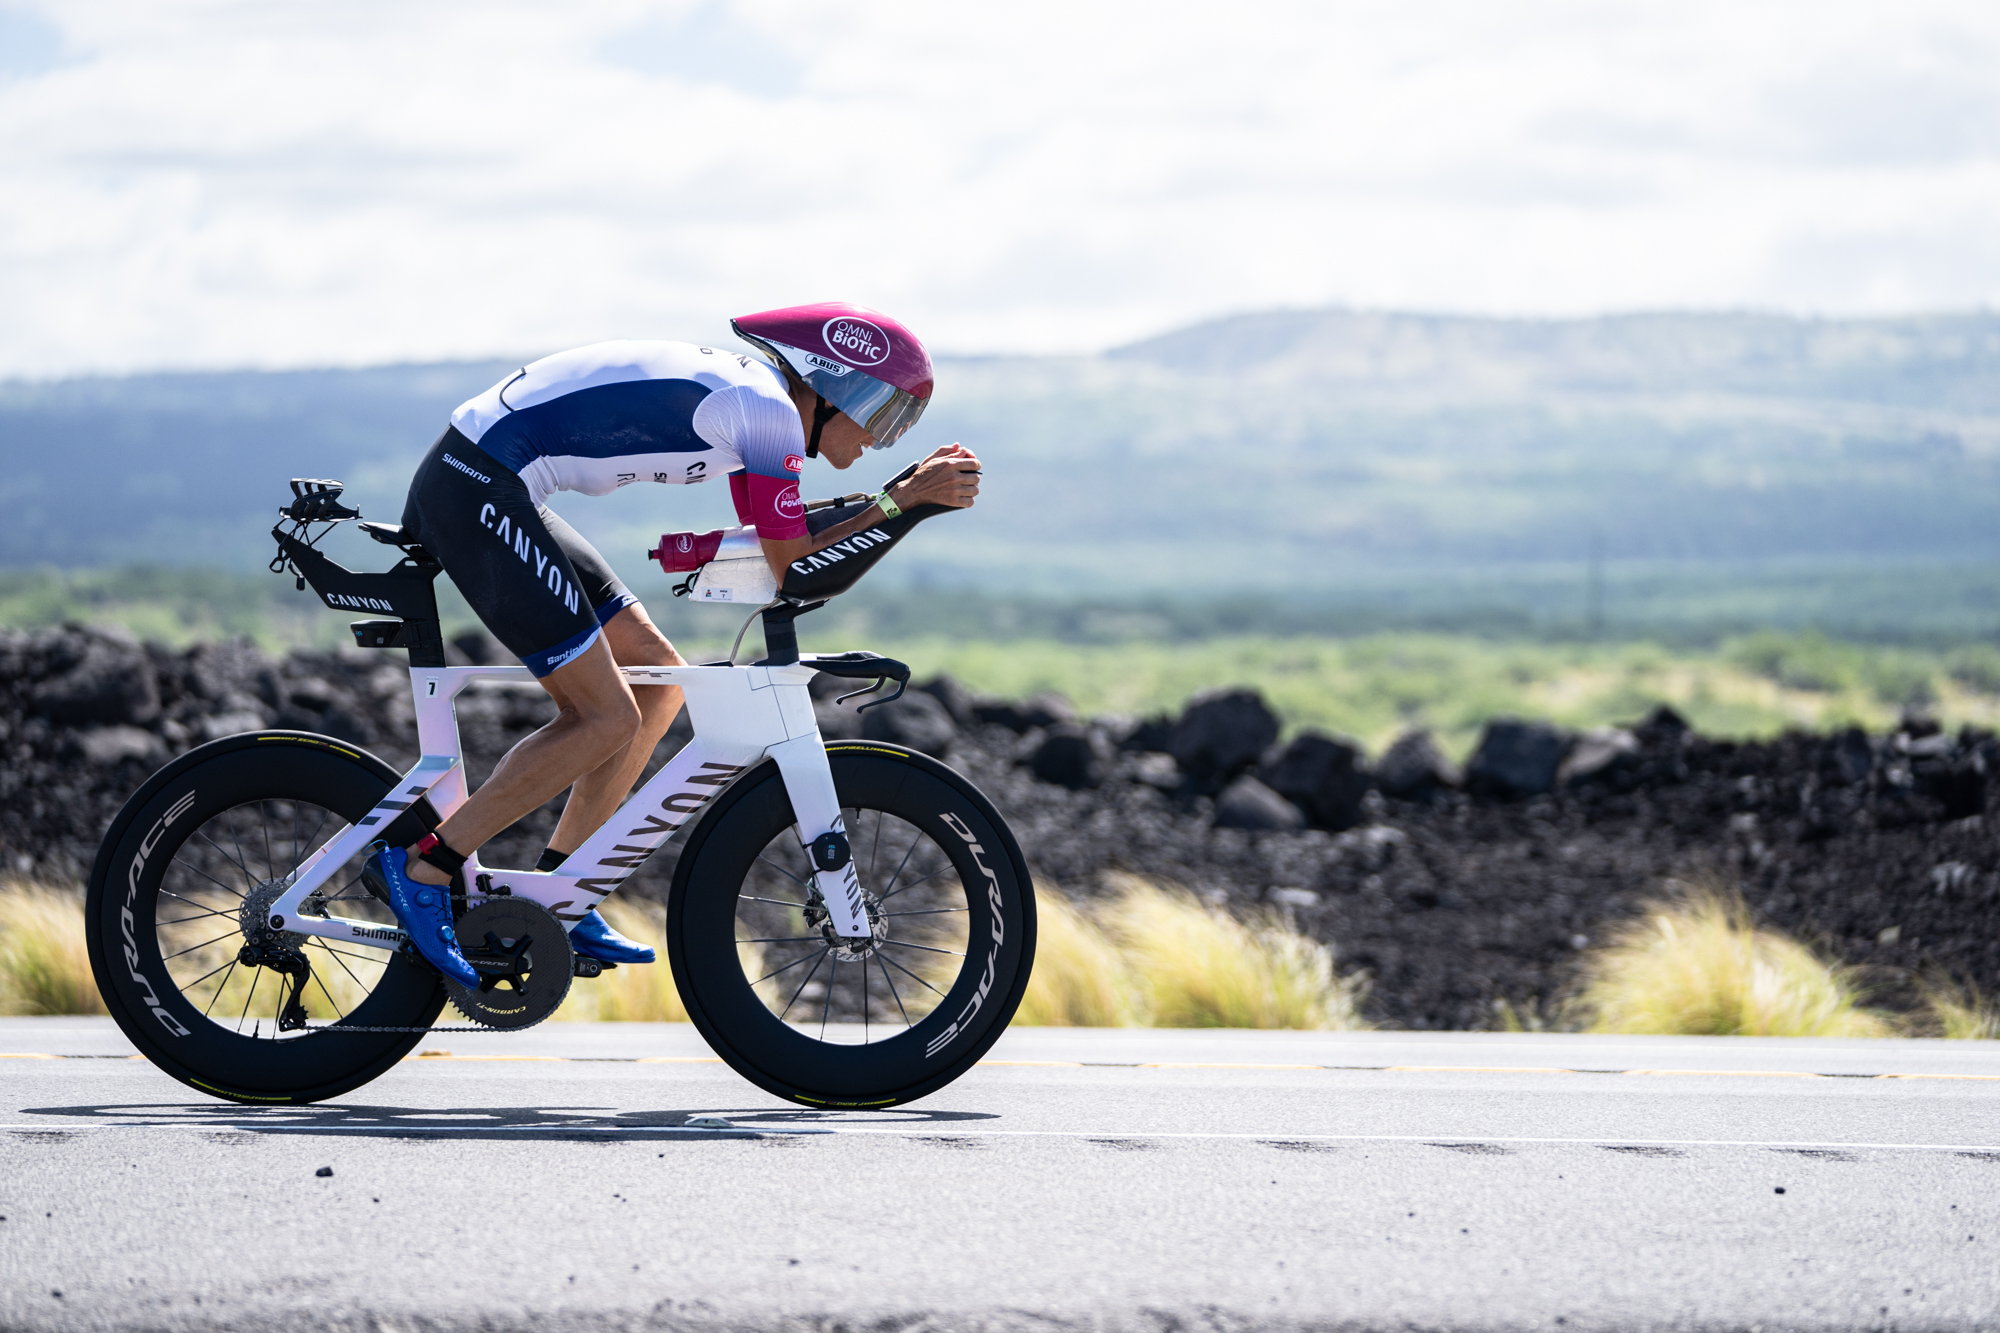
When it comes to bikes, the brand that has won the bike count going away the past couple of years continues to pull away from the pack. Canyon essentially went from being one out of every five bikes counted to one out of every four in a single championship cycle. And it’s nibbling share away from all of the other top competitors in the count: Cervelo, Trek, Quintana Roo, and Specialized. If you narrow it to just the top three brands (Canyon, Cervelo, and Trek), you’re covering over half of the field.
It was also a good year for some of the small to mid-size brands in bikes. Scott saw a significant increase over 2025, bumping ahead of BMC and Felt in the process. Ventum’s relative share jumped 168% year-over-year, thanks in no small part to the Tempus. KU also effectively doubled its share over 2025.
| Brand | 2025 share | 2026 share |
|---|---|---|
| Canyon | 20.71% | 23.48% |
| Cervelo | 18.99% | 17.85% |
| Trek | 16.17% | 14.35% |
| Quintana Roo | 6.55% | 6.32% |
| Specialized | 6.09% | 5.77% |
| Argon 18 | 4.08% | 4.01% |
| Scott | 3.06% | 3.60% |
| BMC | 3.14% | 3.27% |
| Felt | 3.73% | 2.91% |
| Cube | 2.82% | 2.77% |
| Giant | 2.90% | 2.54% |
| Ventum ▲ | 0.67% | 1.80% |
| Ceepo | 1.15% | 1.61% |
| Pinarello | 1.21% | 1.43% |
| Factor | 0.97% | 1.25% |
| Orbea | 1.80% | 1.15% |
| KU ▲ | 0.59% | 1.11% |
| LIV | 2.01% | 1.01% |
| CADEX | 0.64% | 0.92% |
| Wilier ▲ | 0.19% | 0.60% |
| Dimond | 0.48% | 0.51% |
| Ridley ▲ | 0.21% | 0.51% |
| Cannondale | 1.05% | 0.32% |
| Colnago ▲ | 0.13% | 0.32% |
| Look | 0.21% | 0.28% |
| Parlee ▲ | 0.11% | 0.23% |
| Focus | 0.11% | 0.05% |
| Guru | 0.05% | 0.05% |
| Airsteem | 0.19% | — |
| Other Brands* | — | 4.28% |
Athlete Upgrade Dollars are Going to Aerobars
When I first started racing triathlon more than fifteen years ago, it was relatively common for athletes to use bike frame sets as a blank canvas to build their dream machines, particularly for those athletes who would be venturing their way to Kona. There wasn’t much put in for “stock.” If you had to piecemeal your bike together, so be it. You’d start with your basic build, and then upgrade components as you went along. So you had a standard box rim, or a set of Mavics, as your base wheelset, and then you would upgrade your bike with a set of Zipps or HEDs or other brand.
That trend has been slowly flipping in the last decade or so, likely thanks in no small part to three different factors. First, it’s probably attributable to the rise of direct-to-consumer purchasing for bikes. Just within the top five bike brands, two of them (Canyon and Quintana Roo) operate robust direct-to-consumer sales operations, and they offer OEM-spec high level wheels from the likes of DT Swiss, Zipp, and HED at prices that you can’t otherwise get as a consumer.
There’s also something to be said about having to swap wheels around with disc braked bikes and thru axles. Yes, on paper, it’s supposed to be “easier.” But if you’ve never experienced the pain of accidentally grabbing a brake with a wheel out of the frame and having to reset the pads, or discovering that this other wheel has just a hair more rotor width than the other one, well, I am happy for you. But for the rest of us, it makes me not want to change wheels. (And people wonder why I train indoors.)
And lastly, it’s just part of the overall trend of bike cost. When bikes are above $5,000, there’s a certain expectation that, for the most part, you’re mostly done spending. So if you can get a race wheel as part of your overall purchase, you just go ahead and do so.
That appears to be the case, as OEM spec options or house brands make up almost two thirds of the total count.
| Brand | 2025 share | 2026 share |
|---|---|---|
| DT Swiss | 27.76% | 23.91% |
| Zipp | 21.98% | 18.19% |
| HED | 6.74% | 7.97% |
| Bontrager | 11.77% | 6.34% |
| ENVE | 6.31% | 4.32% |
| Swiss Side | 3.53% | 3.94% |
| Roval | 5.64% | 3.17% |
| Cadex ▲ | 1.50% | 2.93% |
| Reynolds | 3.35% | 2.50% |
| Vision | 2.64% | 1.97% |
| Princeton Carbonworks† | — | 1.68% |
| Newmen† | — | 1.58% |
| Giant | 2.46% | 1.25% |
| FFWD | 0.82% | 1.10% |
| Ku† | — | 0.86% |
| Black Inc.† | — | 0.86% |
| Shimano | 1.18% | 0.77% |
| Hunt | 1.25% | 0.48% |
| Parcours† | — | 0.43% |
| Flo | 0.68% | 0.29% |
| Corima | 0.25% | 0.24% |
| Profile Design | 0.36% | 0.24% |
| Lightweight† | — | 0.24% |
| Fulcrum | 0.71% | 0.19% |
| Syncros | 1.07% | 0.05% |
| Other | — | 9.27% |
| Reserve | — | 5.23% |
† marks brands counted for the first time in 2026.
So if athletes are buying wheels as part of their original bike purchase, where are they spending money instead?
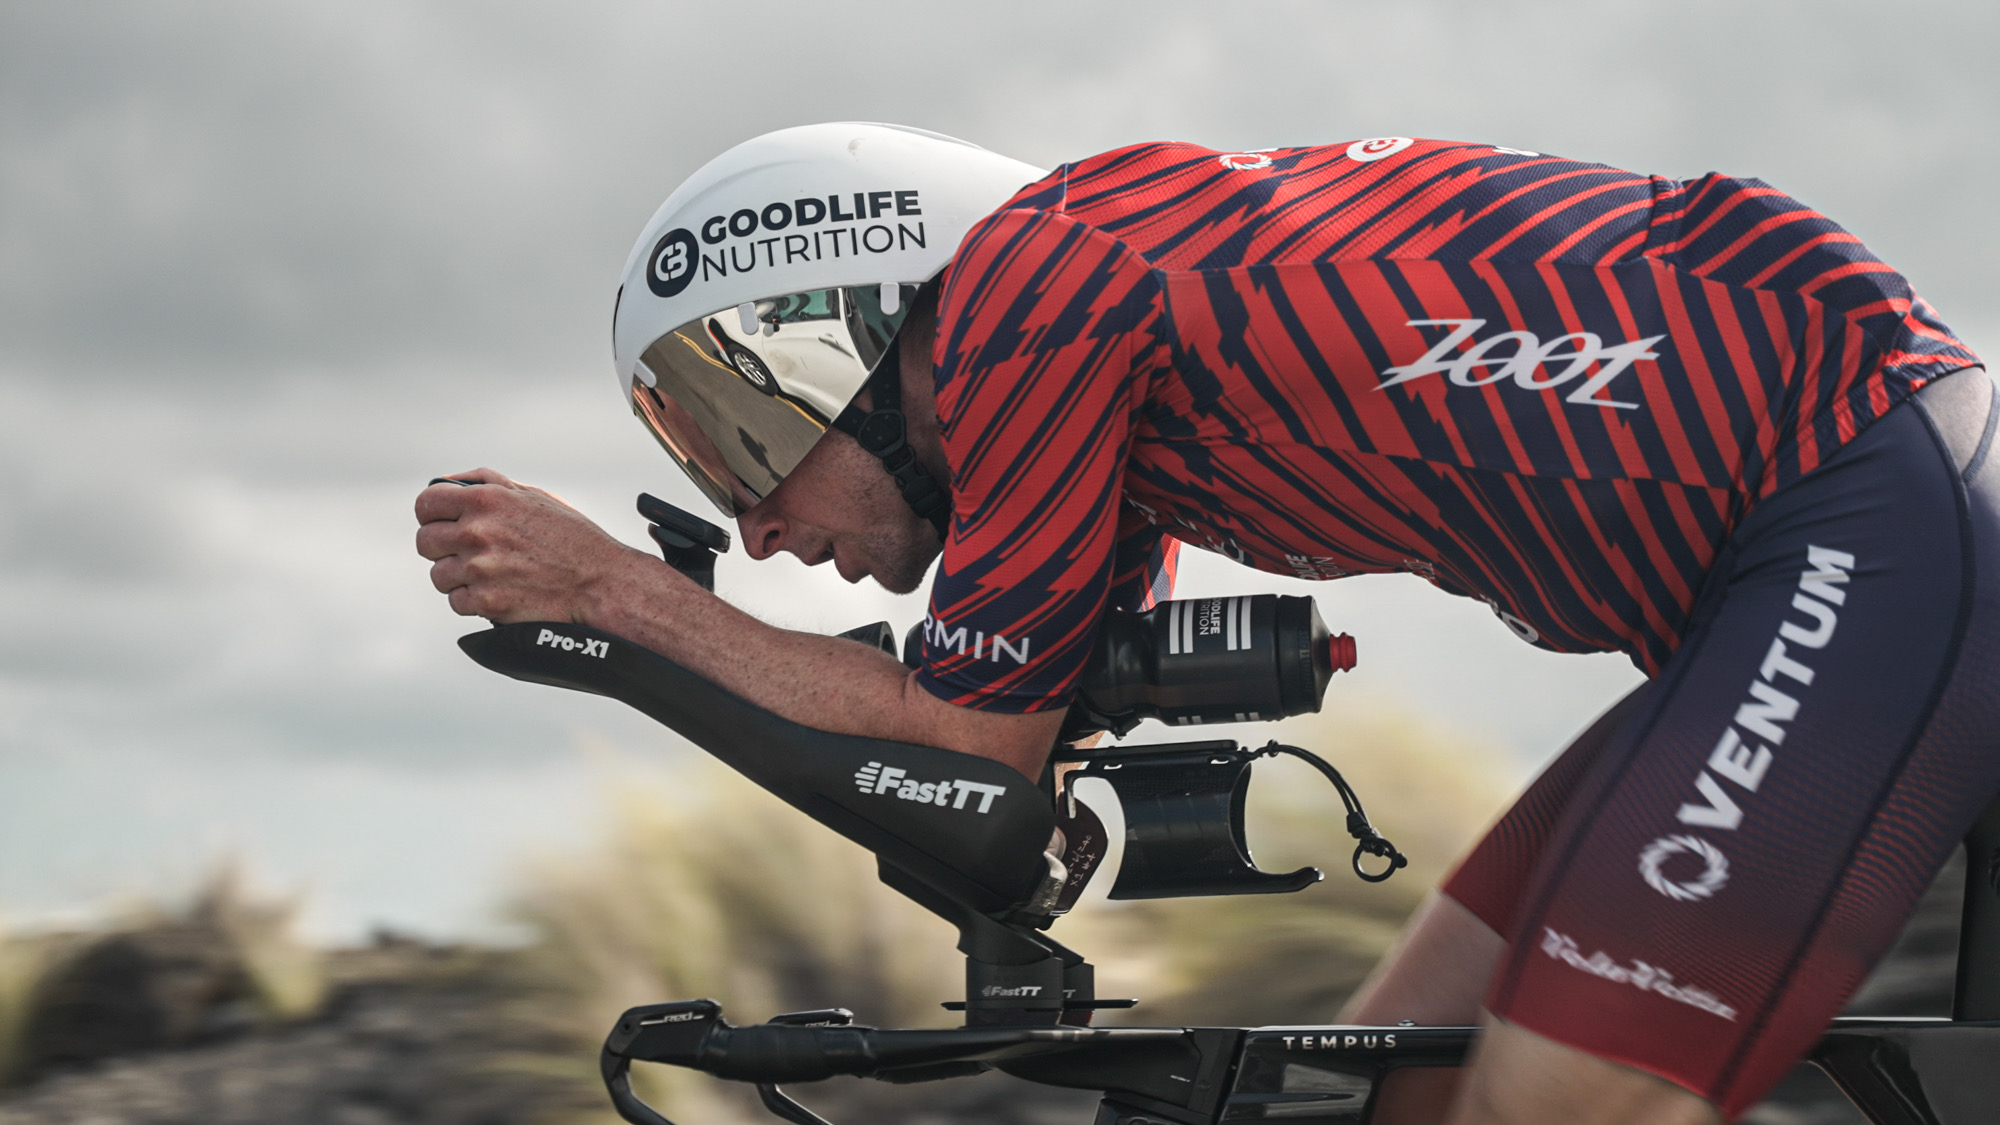
It’s aerobars. Whether you want to call this new generation of aerobars monobars or aero shovels or unregulated fairings, we’re seeing the kind of diversification in aerobar specification that we used to see with wheel sets. Profile Design remains the market leader, but we’re seeing other brands gaining in share quickly. One of them integrates quite neatly with their bikes — Canyon and its latest generation Speedmax has its own integrated bar, and it appears to be at least part of the driving force behind the adoption of their bikes.
Some other brands that are capturing share include:
- FastTT with 5.9% of the count, and new to the stats this year
- Drag2Zero with 3.5% of the count, and increased raw count numbers year over year
And, ultimately, we’re seeing a proliferation of brands that we are yet to appropriately capture. This year was the first time we were truly north of 10% share for the “other” category, with almost a fifth of aerobars coming from brands we either haven’t seen before in large quantities or were otherwise not identifiable. We’ll need to do some additional digging and look at who to include for next year’s survey. The other thing to keep in mind is some of these brands are being made in someone’s basement and to be frank we couldn’t tell you what they are even if we where able to walk the bike over and hold the thing in our hands.
| Brand | 2025 share | 2026 share |
|---|---|---|
| Profile Design | 27.85% | 23.34% |
| Canyon | 10.28% | 13.34% |
| Bontrager / Trek | 11.15% | 7.94% |
| FastTT† | — | 5.87% |
| Zipp | 6.02% | 4.65% |
| Vision | 4.96% | 3.76% |
| Drag2Zero ▲ | 1.49% | 3.48% |
| Giant/Liv | 2.30% | 3.19% |
| 51 Speed Shop | 2.63% | 2.40% |
| Cervelo | 4.15% | 2.35% |
| Aero Coach | 2.19% | 1.97% |
| Specialized | 2.02% | 1.74% |
| 3T | 1.99% | 1.69% |
| Tririg | 0.87% | 1.46% |
| Sync | 1.20% | 1.36% |
| Deda | 0.92% | 0.80% |
| Aerogain† | — | 0.75% |
| Argon 18 | 0.73% | 0.56% |
| Wattshop | 0.28% | 0.42% |
| Speedbar | 0.17% | 0.23% |
| Ventum | 0.11% | 0.19% |
| Oval ▲ | 0.08% | 0.19% |
| HED | 0.11% | 0.14% |
| Syntace | 0.14% | 0.09% |
| Shimano/PRO† | — | 0.05% |
| Other | 10.11% | 18.04% |
† marks brands counted for the first time in 2026.
Hydration is Diversifying, Thanks to Aero Systems
For the past decade or so, you could pretty much count hydration systems and their mounts to boil down to Profile Design and X-Lab.
That is no longer the case. We’re seeing sizable changes in the choices athletes are making for hydration mounts. At least on the front end of the bike, that’s changing due to the rapid proliferation of the new generation of aerobars, and the need for your hydration mount to integrate with that bar. And let’s not relive the Great Hydration Rule Debacle…
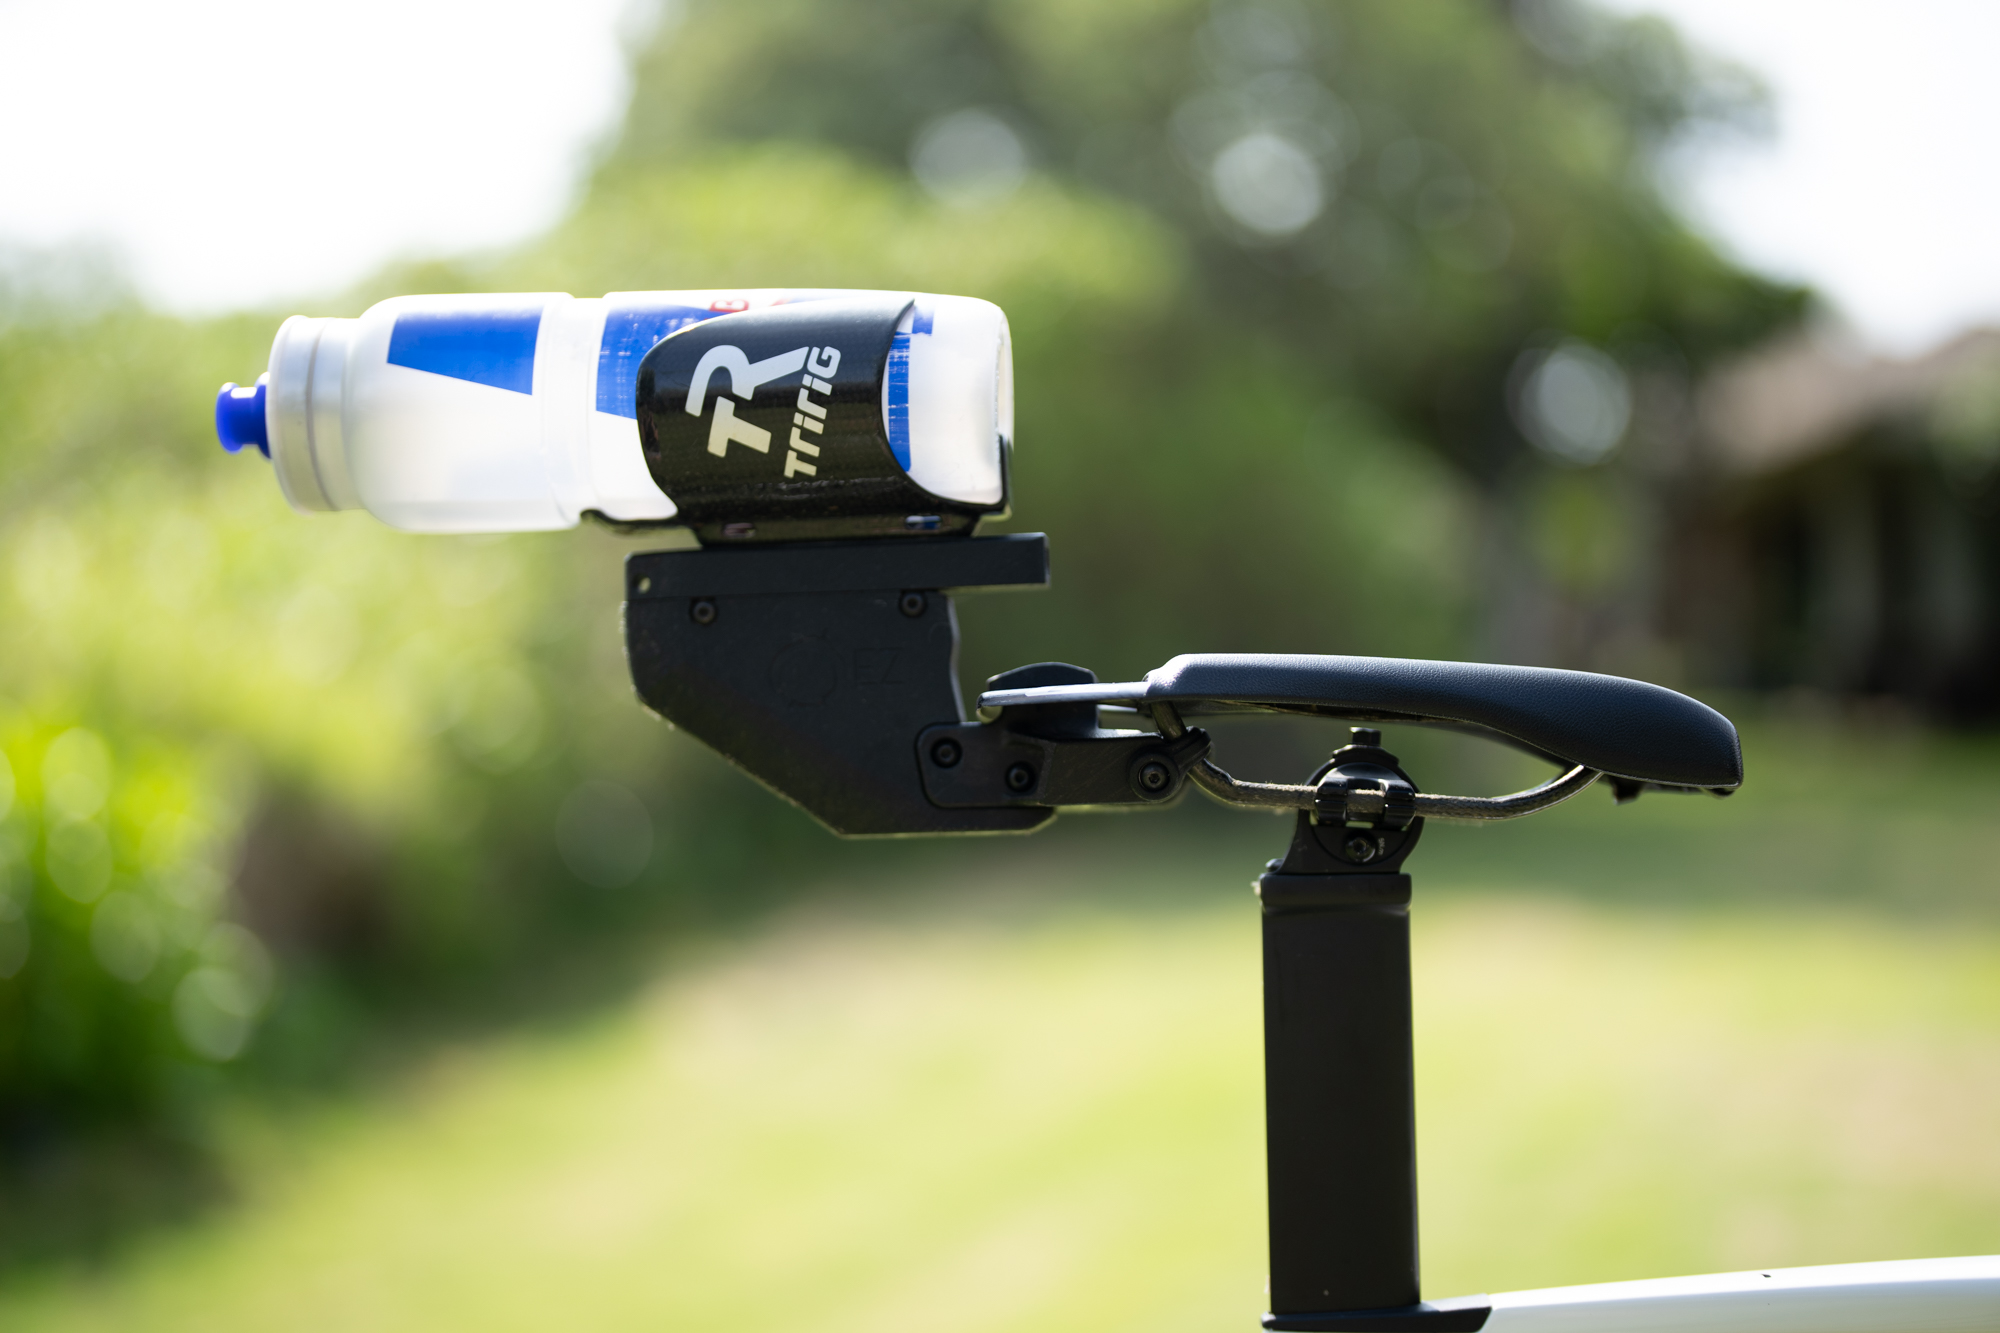
At any rate, it means that X-Lab has ceded almost half of its market share in a single year. And the biggest gain in the counts goes to EZ Gains, who has over a fifth of the field riding using their rear hydration system. Up front, the big winner is TriRig — who integrates cleanly with EZ Gains — which jumped from under 1% of the market to over 12%. AeroGain, also new to the counts this year, was just under 8.5% of the field represented.
Still, with roughly 30% of the front hydration count and just under 15% of the rear count chalked up to “other brands,” we’ve got some more work to do on adding some additional companies to the mix.
| Front Hydration Brand | 2025 share | 2026 share |
|---|---|---|
| Profile Design | 28.64% | 19.77% |
| X-Lab | 23.33% | 12.14% |
| TriRig | 0.86% | 11.85% |
| Integrated | 20.93% | 8.55% |
| AeroGain | — | 8.44% |
| Bontrager | 5.70% | 4.62% |
| Speedfil | 1.50% | 1.85% |
| Giant | 0.86% | 0.52% |
| Rear Hydration Brand | 2025 share | 2026 share |
|---|---|---|
| EZ Gains | — | 22.66% |
| Integrated | 9.55% | 19.70% |
| Profile Design | 20.84% | 17.97% |
| X-Lab | 32.95% | 17.07% |
| Fizik | 1.44% | 4.94% |
| Tacx | 3.18% | 1.80% |
| TriRig | 0.89% | 0.64% |
| Elite | 5.67% | 0.45% |
| AeroGain | — | 0.39% |


Start the discussion at forum.slowtwitch.com